

Introduction
Healthcare spending is a lingering political issue both because it has become a significant fraction of total GDP and also because of perceived inequities. Here, I consider various theories as to why costs have increased, the data that support or refute them, and the prospects of future cost control due to improved technologies.
Cost Trends since 1960
Many factors are blamed for high US healthcare costs. Some of the favorites are: high drug prices; insurance companies; regulations; hospitals; over testing; gold plated care; chronic disease; aging population; cost of medical school and student debt; moral hazard. I look at these possibilities using government data (found at https://www.cms.gov/data-research/statistics-trends-and-reports/national-health-expenditure-data/historical), but first consider some prior work as a useful benchmark.
Using public data, they identify where 60% of the excess US healthcare spending vs the OECD-average comes from. They summarize with the following:
- U.S. pays more in administrative costs of insurance ~15%
- U.S. providers spend more on administrative activities ~15%
- U.S. pays more for prescription drugs ~10%
- U.S. physicians earn more ~10%
- U.S. registered nurses earn more ~5%
- U.S. invests more in medical machinery and equipment <5%
- Sum of components estimated ~60%
They surmise that the remaining 40% of the gap could be at least partially explained by greater “service intensity”.
I think these numbers represent a decent benchmark. However, I do take issue with the definition of the gap based on per-capita spending. A beater measure is the ratio of spending to GDP.
At one extreme, if one considers that U.S. per-capita GDP is about $86K (in 2024) compared to the aggregate OECD average of about $48K, then there is almost no gap. But this is too extreme an adjustment. Instead, if we take the average of country-level spending ratio’s we find an OECD average of about 12.75% (in 2023) vs 17.7% in the US (in 2023, 17.25% in 2024). Of course, the OECD average is increased by the U.S., but I still believe the proper gap is more like 30-40% than the 100% quoted in the commonwealth article. But to avoid confusion I will continue to use the % given in the above table.
Now, consider an overview of the U.S. as captured by the following graphs:
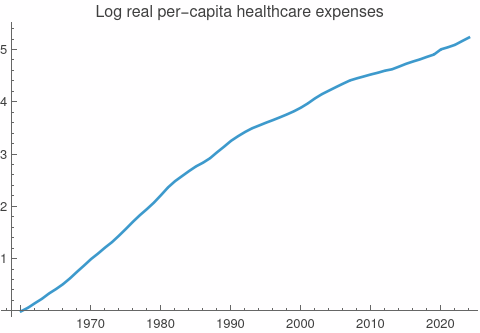
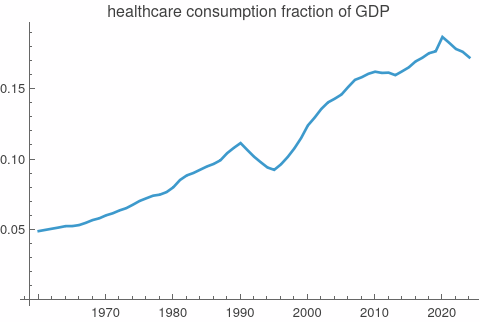
It is immediate from the second graph that something interesting happened from1989-1993. The dip in cost fraction is attributed to the rise of HMO’s: Managed-care enrollment rose from just over 20% of insured Americans in 1985 to more than 70% by 1993. The dip was temporary. However, the first graph indicates that the slow-down in per-capita spending has been sustained. I suspect the reason is related to the following data:
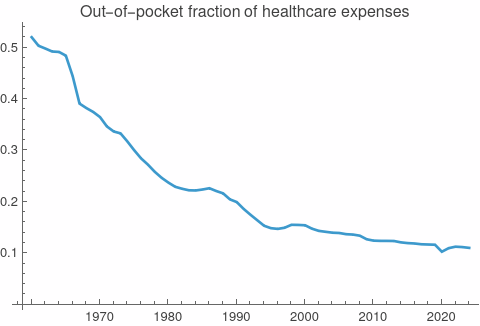
Up until 1993 or so, insurance (including medicare and medicaid) was paying an ever increasing share of total costs which lead to demand increasing faster than population. After 1993, the trend is much flatter, and so the boost to demand has petered out.
Big pharma
I suspect suspicion and dislike of drug companies is a holdover from a time when they were one of the most significant out of pocket expenses for consumers. Another belief that may contribute to loathing is that they spend more on advertising than R&D.
It is true that on-patent drugs cost more in the US than elsewhere. It is less appreciated that US generics are actually cheaper, and constitute 90% of prescriptions (albeit just 12% of total drug spending). On the other hand the R&D claim is false. I don't know if the wrong claim is intentional, or due to lack of understanding of basic accounting --- the difference between advertising and SGA.
According to the CBO, the % of sales spent by pharma has increased from 12% of sales in 2000 to 25% in 2021. This exceeds the levels of any other industry (for comparison, the next two R&D intensive industries, software and semiconductors, were both at about 15% R&D to sales in 2021). Even pre-covid (2019), pharma R&D was about 23% of sales.
In any event, the following graphs shows pharma sales as a % of total healthcare consumption
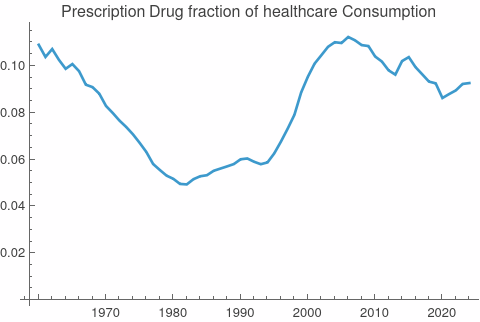
Big pharma has benefited from health care inflation, but at less than 10% of total spending, it is hard to see it as a driver. Looked at another way, big drug companies have been lousy investments for decades with a few exceptions (such as Eli Lilly, benefiting from GLP’s). For example, Pfizer’s stock price, at $28/sh, is the same price now as it was in 1998.
In short, with drug spending in line with healthcare growth, but R&D growing much faster, it seems unlikely that the future will see lower drug prices provided US firms remain dominant and continue to accept lower prices abroad. If Chinese firms continue their rapid ascent, this may change, but may not be a good thing for the U.S..
Insurance companies
There is no question that, in contrast to drug companies, insurance companies have been excellent investments since the ACA (with some give-back in the last two years). For example, UnitedHealth Group increased about twenty-fold from roughly the time of the passage of the ACA (in 2010) until mid-2024.
By law, ACA policies must pay 80 or 85% of revenues out to cover patient costs (or “improvements”).
As an example, in their 2025 10K, UnitedHealth Group reports medical loss ratio’s of 89.1 %,
85.5 % , and 83.2 % for the years 2025,2024, and 2023, respectively. They also reported operating costs (excluding cost of products sold --- they do more than just health insurance which supplies about ¾ of revenues) of just under $60B. This works out to about $1100 per patient, which jibes with the figures in the commonwealth article cited above. This article also states US insurance administrative costs are a factor of five larger, per capita, than the OECD average. If even close to true, this suggests considerable waste (albeit the employees of insurance firms may not consider themselves to be wastes).
If so, then the following chart suggests considerable savings can be obtained:
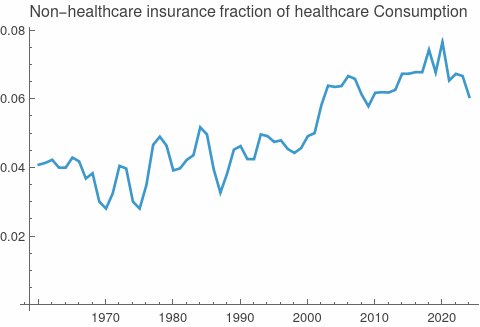
Note: “Non-healthcare insurance” refers to the component of healthcare insurance that is not medical (i.e., administrative) and not to insurance that is not healthcare related.
The other half of the 15% gap attributed to administrative costs in the commonwealth article is composed of regulatory costs, but also partially of costs related to insurance (e.g., wading through the occasionally difficult pre-approval process).
Regulation
True regulatory costs involve too many counterfactuals to allow accurate estimation. There are not only direct compliance costs, but also costs associated with changing behavior, which should actually be beneficial if the regulation is a good one. For example, requiring a more expensive procedure may reduce future care costs more than the increased cost of the procedure.
But one can try and obtain order of magnitude estimates of at least the direct administrative and the American hospital Association did just that in 2017 with a figure of $39B for compliance costs. In that year, total hospital spending was $1,08T, so just under 4%. If we extrapolate to 4% of total healthcare spending (so $200B), the effect is noticeable.
Overtesting
In 2024 medicare part B spent $8.6B on testing, or about 1.5% of total spending. While “defensive medicine” (or offensive medicine, given that physician `bans’ on owning medical testing facilities are easily skirted) is often cited as a driver of health care costs, I do not see it in the numbers.
Gold plated care
This is related to over-testing, but can also include over-treatment or using an expensive technology (e.g., MRI) when a cheaper one will do (e.g., x-ray). The commonwealth article does document US patients get more procedures, but that it is more likely they are getting better care than overtreatment.
One area that clearly does have symptoms of “gold platting” in the U.S. is the ER. Ambulances are now mini-hospitals and often charge $5000 or more per trip. Of course, if it saves your life, will you object?
Hospital
Hospital’s share of total spending has been mostly declining.
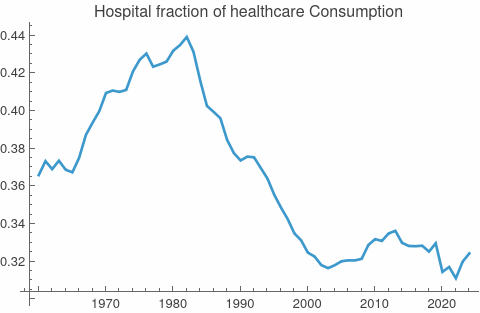
Of course, the average length of a hospital stay has fallen from 7.7 days in 1960 to about 4.5 today as well. And hospital rates increased much faster than the broad CPI (more on this soon).
Extensive government support and non-transparent pricing allow hospitals to pass on costs more easily than most businesses. This can allow administrative bloat? Do we see it? Perhaps, In
it is reported that the number of hospital administrators increased from 224,070 in 2004 to 565,840 in 2024 (150% increase) while physicians (total, not just hospital-based) grew from 471,390 to 778,450 (65% increase). However, this period includes passage of the ACA as well as other regulations that increase compliance needs. So, it is not clear how much is “bloat”.
Chronic Disease
In https://www.cdc.gov/chronic-disease/data-research/facts-stats/index.html the CDC claims that 90% of healthcare costs are due to chronic disease. But most of these diseases would not have been chronic in the past simply because you would have dropped dead shortly after getting them (e.g., heart attack) or simply not been treated. Most are now chronic precisely because they can be treated. So, is this really a failure?
What is relevant is the trend in the development of the disease, e.g., diabetes. The answer is such diseases are increasing in prevalence, and the most likely cause is obesity. I suspect GLP’s will “bend the curve” substantially, but this remains to be seen.
Medical schools costs.
Many countries pay for doctor’s educations. This actually biases the healthcare spending gap because these costs will not appear as healthcare costs in other nations accounts, but will in the US (because Dr’s charge more to repay their loans). However, this represents at most 2% of annual healthcare consumption (assuming the annual 30K med school graduates all pay full annual tuition of about $90K/yr for 4 years).
Aging
If any story makes sense, it’s surely the aging population, no? Well, consider these three graphs:
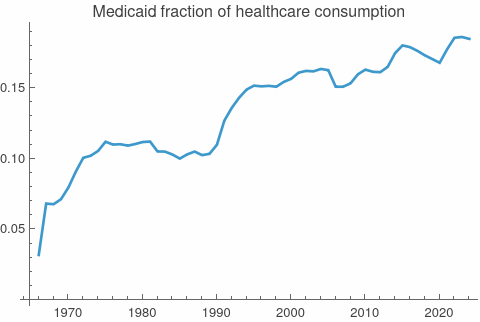
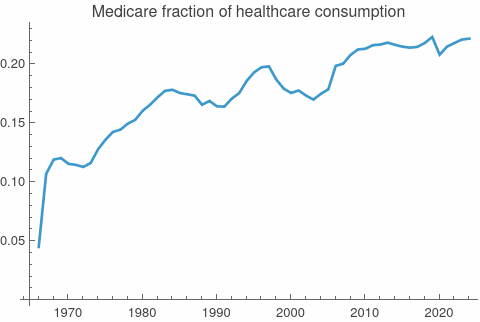
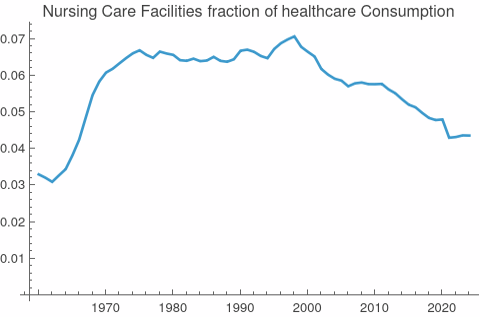
The share spent on nursing homes is falling! This despite the fact that lifespans have greatly increased and (I suspect) children are less likely to take care of aging parents. And Medicaid is growing (slightly) faster than medicare.
Moral Hazard
By law, Americans are required to be enrolled in some form of ACA compliant health insurance, or face penalties. Most comply. To consumers, the insurance represents a fixed sunk cost and covers almost 90% of medical care. A consumer who pays only 10-15% of the actual cost has little incentive to ration care or compare prices. While hospitals have been legally required to post prices for some time, many simply ignore the law with little consequence. And who compares prices in an emergency. Patients take what they get.
The coincidence of the end of the fall in the out-of-pocket fraction around 1993 with a slowdown in the rate of spending growth provides some evidence for “use it or lose it” picture. A more direct example is championed by the economist Mark Perry, via comparing costs of insured medical services with those that are (usually) not covered --- cosmetic surgery. The numbers are striking:
Inflation between 1998 and 2020
- All cosmetic surgery, 27.7%,
- Cosmetic surgery weighted by use, 35.8%
- CPI overall 58.77%,
- Cpi medical care services 128%,
- CPI Hospital services 220.4%
The problem with the moral hazard theory is that it applies to other countries as well, although many restrict healthcare to some extent (through limited treatments, long wait times, and treatment denial). In either event, it is hard to see this problem going away in a way Americans will find acceptable.
Future Costs
The hope that technology will do to healthcare what it has done to most other areas of the economy, increase quality, cut costs, has been realized w.r.t. quality but not costs. A number of developments may finally lead to lower costs.
GLP’s
Obesity is probably the main driver of chronic disease in America. The direct effects are clear: increased risk of diabetes, cancer, heart disease. These are not just main killers but also can require decades of treatments. Indirectly, obesity is correlated with poverty and depression, which are also significant and expensive problems. In this case, the causality probably operates both ways. Obesity can cause low self-esteem and is associated with work place discrimination.
The uptake of GLP’s has been rapid and significant. The earliest evidence of a real effect can be seen not in obesity statistics (which will lag) but in the effect on food stocks, which have fallen sharply over the last two years. In short, GLP’s may have a major cost reduction benefit.
AI
AI has the potential to impact healthcare spending in many ways. The most exciting, of course, is the discovery of new treatments. This may reduce costs (if, e.g., curing chronic disease) but could also increase costs by increasing demand. However, as discussed further below, this requires there actually being many useful things to discover about human disease that we are currently missing.
The more mundane cost reduction route is via improved back-office efficiency. Of this, it is interesting that healthcare AI spending represented less than 7% of total end-user AI spending in 2025, well below health-care's near 20% of GDP. Clearly, the privacy issues and attendant regulatory maze will slow AI adoption in healthcare.
An intermediate cost reduction route is via prevention or detection of medical errors. While estimates place these costs at less than 1% of healthcare spending, the impact on patients (and doctors) is enlarged psychologically (assuming the error is recognized, which is not always the case).
However, the data clearly show that insurance could be the killer app for AI in healthcare. Already, providers are using AI to help get pre-approvals, and insurance companies are using AI to reject them. But, in particular, AI will be much better able to efficiently wade through the thousands of different plans and providers, often separately negotiated, and figure out what is covered and what is not. I look forward to this day, but perhaps I dream.
Difficulties in bringing the AI world to healthcare
Large language models have gone past mere syntax and grammar to discern meaning. This is quite impressive. However, it is important to note that these models were trained on enormous quantities of text that had meaning. If they had been trained on baby talk, I think it's obvious success would have ben lacking.
Unfortunately, our understanding of the human bio-chemical system is probably closer to baby talk than Shakespeare. It is only recently that "junk DNA" has been recognized as not junk, but a crucial element of controlling gene expression. Since introns (nee, junk DNA) are about 100 times more numerous than exons, even the DNA component of the control system of gene expression is very incomplete. The fact that there is substantial epigenetic control as well (also hard to understand) makes the problem even harder.
Can AI make sense of this tangled web? Time will tell, but I suspect there will be many bodies on the journey. That said, the ability of AI to attend to an incredible number of details may be exactly what is needed to make sense of the human biological system. Or at least not to screw it up with a bad intervention.
While there are currently some promising AI assisted drugs under investigation, there have also been a number of recent failures. These include: BenevolentAI’s BEN-2293, for eczema (failed on its primary Phase IIa measures); Exscientia/Sumitomo’s DSP-1181, for obsessive-compulsive disorder (discontinued after Phase I); Exscientia’s cancer candidate EXS-21546. (failed in phase I/II)
A final issue is the matter of data access. Healthcare data is both lucrative and subject to HPPAA regulations. AI companies will not be allowed to scrape hospital and clinic data at will as they did when training LLM's. But, so long as the VC funding holds up, this should not be a serious roadblock as data deals will be made.
Conclusions
Healthcare spending has grown much faster than economies across all OECD members. This is a natural consequence of societies getting richer and medical capabilities improving. However, the US does have a gap in spending vs. other companies (about 30% if measured by the health spending to GDP ratio) and a significant fraction of that gap seems attributable to administrative overhead. While some of this may be attributed to administrative bloat, the dominant cause is probably the complicated overlay of laws and diverse coverage plans. AI may be able to navigate this structure far more effectively and cheaply. Of course, if true, this will only come about with extensive job loss. Will this be allowed?
Read Comments